ECG 3s and 5s: tips for reading ECGs
Heart diseases
Heart diseases--prevention
Electrocardiography is regularly used in the investigation of heart problems, but the correct interpretation and understanding of an ECG readout can be difficult for students to learn and teachers to teach. An aide memoire that breaks down many of the parameters in ECG evaluation into ‘3s and 5s’ can aid in remembering the details.
- The ECG offers much valuable information for the assessment of heart problems and patient care.
- Interpretation of the ECG requires a systematic approach.
- Reading the ECG using a simple aide memoire that breaks down important components into ‘3s and 5s’ can help the novice reader gain confidence.
The ECG is ubiquitous in modern medicine; it has been a regular part of the assessment of the heart in different clinical situations for decades. However, the art of reading and understanding the ECG has long caused fear in students and apprehension in teachers. Books have been written about making the ‘ECG easy’, suggesting that, at first glance, it is probably not.
This article presents an aide memoire known as ‘ECG 3s and 5s’, which is based on an ECG talk given to a group of trainees. It attempts to simplify some of the detail that often bogs down the teaching about ECGs. It is not intended as a comprehensive nor an exact description but as a simple basis for the novice ECG reader to feel comfortable quickly and to then build on that experience. Further reading is available elsewhere to provide a more detailed understanding of the ECG.1
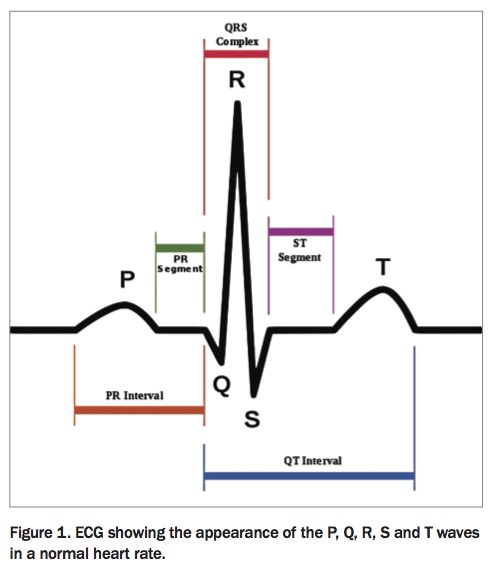
The premise of this aide memoire is that many of the parameters in ECG evaluation (categories, measurements, etc) can be broken down into ‘3s’ or ‘5s’, which can help in remembering the details. The steps and rules involved assume a prior understanding of ECG language and the ability to name P, Q, R, S and T waves (Figure 1). It also assumes that the ECG has been acquired correctly, discussion of which is beyond the scope of this article.2
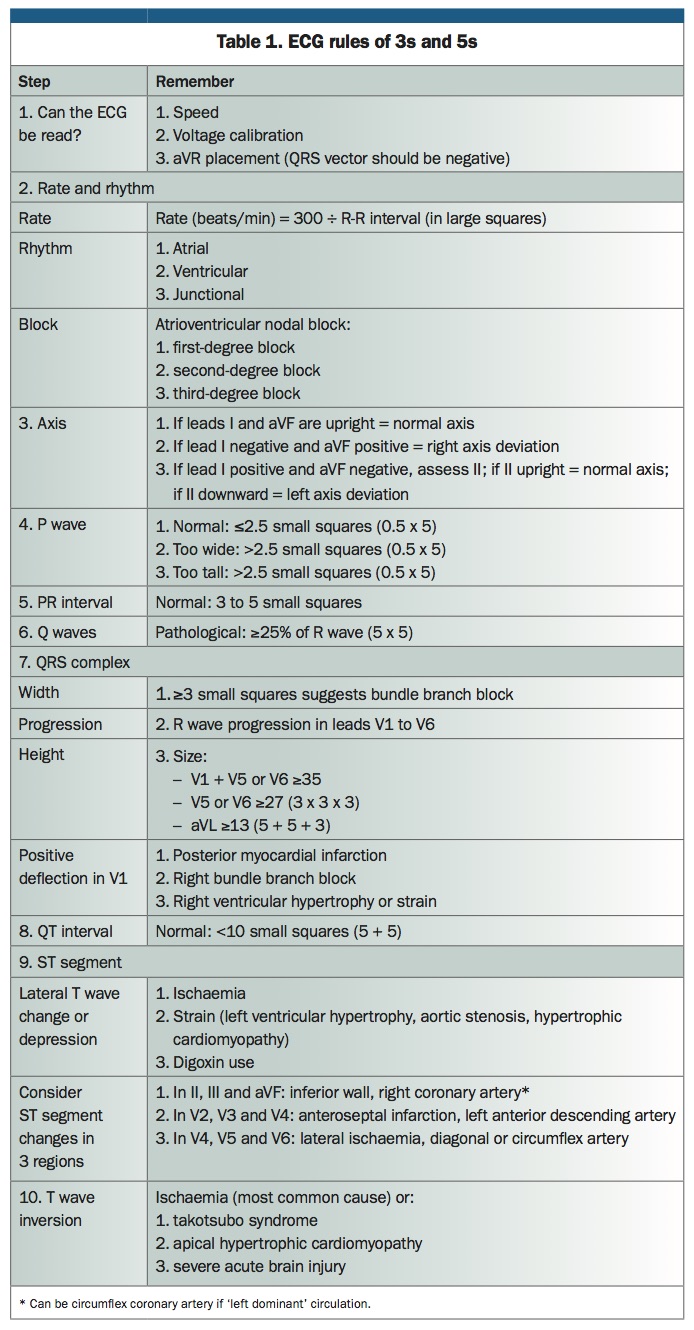
In the following steps, the squares on the ECG grid paper are described as ‘small squares’ (those that measure 1 mm) and ‘large squares’ (that measure 5 mm). Each small square represents 0.04 seconds and each large square represents 0.2 seconds. A summary of the 3s and 5s is presented in Table 1.
Step 1. Can the ECG be read?
Simple and common acquisition errors that could prevent or distort reading of the ECG need to be considered before beginning. This requires checking the following three things:
- Is the paper speed correct? The speed should be 25 mm/s (i.e. 5 x 5).
- Is the voltage calibration set correctly? A voltage of 1 mV equals two large squares, or 10 mm (i.e. 5 + 5).
- Is lead aVR placed correctly? The QRS vector should be negative; if it is not, check whether the limb leads have been reversed. (There can be other less frequent causes, such as pulmonary embolism and dextrocardia.)
Step 2. What is the rate and rhythm?
Most modern 12-lead ECG machines will have automatic readouts of rate. However, if the machine does not, or if using a telemetry strip, the rate can be easily determined as:
rate (beats/min) = 300 ÷ R-R interval (the time between QRS complexes, measured as number of large squares)
The rhythm should then be assessed as one of three types:
- atrial
- ventricular
- junctional.
Block
If there is an atrioventricular nodal block, this can also be described as one of three types:
- first-degree atrioventricular block describes the situation when the PR interval is prolonged (see Step 5)
- second-degree atrioventricular block describes intermittent failure of a P wave to be transmitted to the ventricle
- third-degree atrioventricular block describes complete failure of the P wave to be transmitted to the ventricle.
Note that there are two types of second- degree block – Mobitz 1 and Mobitz 2. An easy way to remember these and the difference between them is that there are ‘two types of second degree’ and the ‘second one is more serious’.
Step 3. Determine the axis
Determining the axis requires looking at three leads – leads I, II and aVF – and assessing in which of three directions the axis lies – normal, leftward or rightward:
- if leads I and aVF are both upright, the axis is normal
- if lead I is negative and aVF is positive, there is right axis deviation
- if lead I is positive and aVF is negative, the axis is determined by lead II: if lead II is upright, the axis is normal; and if lead II is downward, there is left axis deviation.
Step 4. Assess the P wave
The P wave reflects the electrical activity of the atria. If it is too tall, it is suggestive of right atrial hypertrophy. If it is too wide, it is suggestive of left atrial hypertrophy. The P wave is generally considered abnormal if it is taller or wider than 2.5 mm. Thus, the P wave can be assessed based on the following three categories:
- Normal P wave: less than or equal to 2.5 small squares (i.e. 0.5 x 5)
- P wave is too tall: greater than 2.5 small squares (i.e. 0.5 x 5)
- P wave is too wide: greater than 2.5 small squares (i.e. 0.5 x 5).
Step 5. Assess the PR interval
The PR interval reflects the speed of conduction from the atria to the ventricles. A normal PR interval should be in the range of 0.12 to 0.2 seconds. Therefore:
- normal conduction: 3 to 5 small squares.
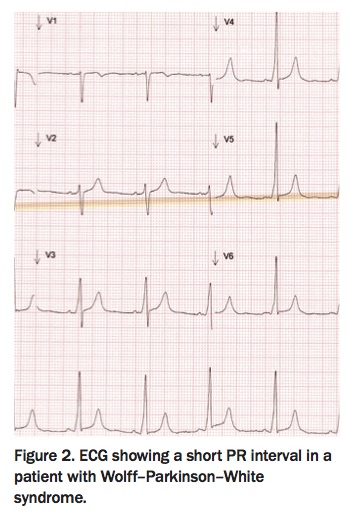
If the PR interval is too fast, the possibility of a pre-excitation syndrome should be considered (Figure 2). If there is delayed conduction through the atrioventricular node, there may be a block.
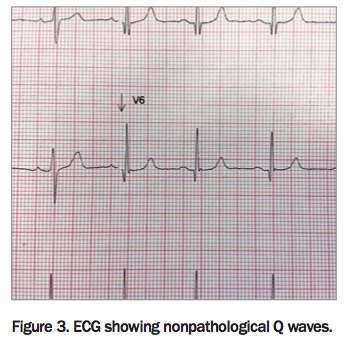
Step 6. Look for Q waves
Q waves may represent evidence of possible previous myocardial infarction, but small Q waves may be part of normal variation (Figure 3). To distinguish pathological from normal Q waves, consider the size relative to the amplitude of the R wave:
- pathological Q wave: greater than or equal to 25% of R wave (i.e. 5 x 5).
Step 7. Assess the QRS complex
The three features of the QRS complex to assess are the width, progression and height.
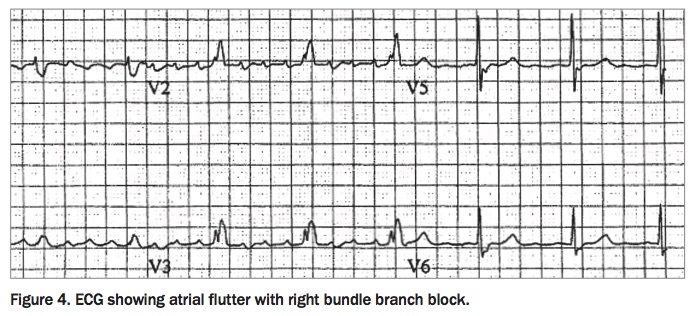
1. Width
Check the width of the QRS complex. If it is too wide, this suggests abnormal conduction through the ventricle or a bundle branch block (Figure 4):
- width greater than or equal to 3 small squares represents a bundle branch block.
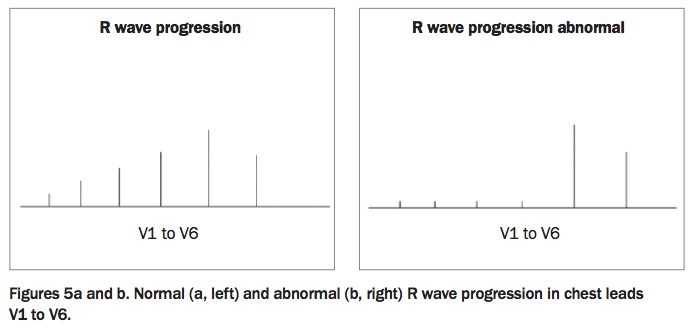
2. Progression
Check whether the R wave progresses normally across the chest leads V1 to V6 (Figure 5). Failure to progress normally can suggest possible previous anterior myocardial infarction, although it can also be related to lead placement and occasionally to left ventricular hypertrophy.
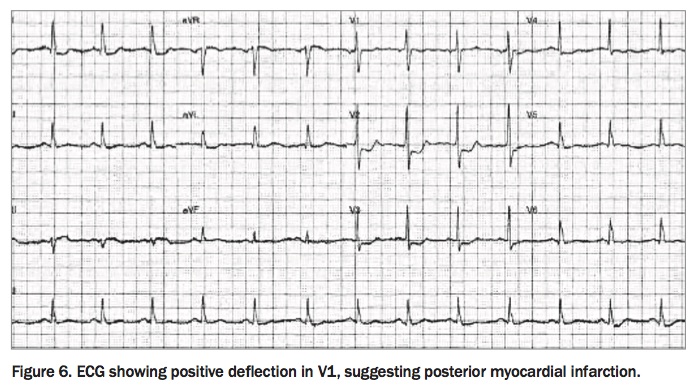
Positive deflection in V1
In looking at R wave progression, start with V1; if this shows a positive deflection, it is important to consider three possible causes:
- posterior myocardial infarction (Figure 6)
- right bundle branch block
- right ventricular hypertrophy or strain.
3. Height
Assess the height of the QRS complex. If the QRS shows increased voltages, this may reflect left ventricular hypertrophy. ECG criteria for left ventricular hypertrophy may also be seen in young, fit athletes as a normal variant. There are many algorithms for assessing left ventricular hypertrophy, suggesting that none are perfect. It is best to choose three and have a low index of suspicion for further testing and echocardiography if clinically indicated. The following three suggested algorithms for assessing height to determine left ventricular hypertrophy size reflect the rules of 3s and 5s:
- Q wave of V1 plus R wave of V5 or V6 is greater than or equal to 35
- R wave of V5 or V6 is greater than or equal to 27 (i.e. 3 x 3 x 3)
- aVL R wave is greater than or equal to 13 (i.e. 5 + 5 + 3).
Step 8. Assess the QT interval
The QT interval gives an indication of rate of repolarisation. It is important in the context of certain drugs (e.g. tricyclic antidepressants and erythromycin) and electrolyte disturbance, as prolongation of the QT interval may be associated with arrhythmia.
It should be remembered that QT interval reduces as heart rate increases, and vice versa; hence, calculation of corrected QT interval may be required for heart rates slower or faster than normal resting heart rate.
At a normal resting heart rate of about 70 beats per minute, the QT interval should be:
- less than 10 small squares (i.e. 5 + 5).
Step 9. Assess the ST segment
There are three main situations that will lead to ST segment depression:
- ischaemia
- strain (left ventricular hypertrophy, aortic stenosis, hypertrophic cardiomyopathy)
- use of digoxin by the patient.
In the setting of ischaemia, ST segment changes – either ST elevation or depression – can offer information on localisation of the affected part of the heart and therefore the affected artery. Thus, ST segment changes should be considered in three arterial regions using three leads for each region:
- In leads II, III and aVF: inferior wall, right coronary artery (can be circumflex coronary artery if ‘left-dominant’ circulation)
- In leads V2, V3 and V4: anteroseptal, left anterior descending artery
- In leads V4, V5 and V6: lateral, diagonal or circumflex artery.
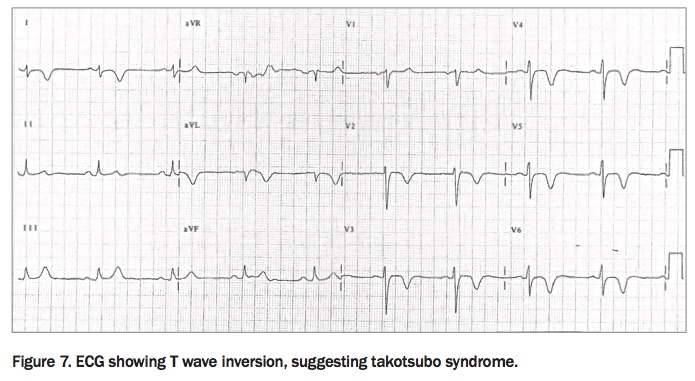
Step 10. T wave inversion
As with ST segment change, the most important clinical cause of T wave depression is ischaemia. The following three less common causes of pronounced T wave inversion also warrant consideration:
- takotsubo syndrome (Figure 7)
- apical hypertrophic cardiomyopathy
- severe acute brain injury.
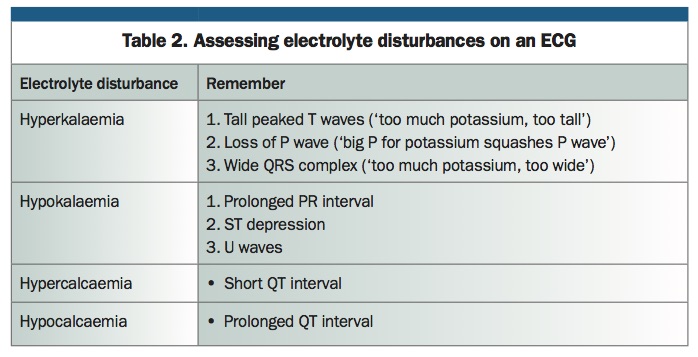
Electrolytes
Although not strictly part of the 3s and 5s, useful tips for remembering how to assess electrolyte disturbances on an ECG are given in Table 2.
Conclusion
To the new reader of ECGs, the amount of information to learn may seem daunting. Using a stepwise methodical approach simplifies ECG reading, reduces mistakes and improves understanding. The ECG 3s and 5s are a simple aide memoire to help the novice reader gain confidence. CT