The (mis)interpretation of diagnostic test results
Laboratory tests
Diagnostic test results should always be interpreted with consideration of the clinical context and should not be assumed to be absolutely accurate. Misinterpretation can be minimised by the use of appropriate tests and being aware of the limitations of tests and the types of errors that occur.
- The general rule with laboratory test results is to consider if the results t the clinical context. Never assume a test result is absolutely accurate, as misleading or frankly incorrect results are common.
- If there is any doubt about a test result, consider repeating the test and/or seek expert advice.
- Have a clear diagnostic question in mind before ordering any diagnostic investigation. An inappropriate test will not contribute to resolving the diagnostic dilemma.
- Be aware of the inherent limitations of the chosen investigation, and select the optimal service provider for that test.
- Always treat the patient and not just the test result; a careful history and physical examination in the first instance is mandatory yet often overlooked.
Picture credit: © BSIP/Diomedia.com
Medical training teaches us the scientific approach: to question, hypothesise and test. We do not believe everything we read in the newspapers, we certainly do not believe everything our politicians promise, and we do not accept new medical therapies on blind faith alone. It is somewhat surprising, therefore, that the results of routine medical investigations, whether a simple blood test or a complex imaging or invasive procedure, are usually accepted without question, as gospel truth. However, if they are actually incorrect then the resultant action may be inappropriate, wasteful, expensive and potentially harmful to the patient. In fact, diagnostic test results are incorrect or misleading far more often than appreciated.
This article outlines the types of errors that may occur with medical tests and suggests methods to minimise the misinterpretation of test results. There is an emphasis on cardiac test results because of the author’s cardiology background; however, the principles stated are essentially applicable to test results from all medical disciplines.
Why test results may be misinterpreted
The reasons for potential misinterpretation of a diagnostic test result are listed below, and will be discussed in turn:
- laboratory error
- reporting error
- quality of test equipment or method
- the report is not presented in an easily understood format
- failure to appreciate reproducibility error of a measured variable
- failure to appreciate predictive accuracy of a test
- failure to appreciate the range of ‘normal’ for a given clinical situation
- test not appropriate for the clinical question being asked.
Laboratory error
As Alexander Pope’s idiom states, ‘to err is human…’, and even machines can get it wrong sometimes. Incorrect laboratory test results are actually quite common in an absolute sense, which is hardly surprising when the large number of tests performed every day is considered. For instance, if 10,000 blood tests are performed in a day, even if the error rate is, for argument’s sake, very low at 0.1%, there will still be 100 false results delivered to doctors on that day.
Human error is the most common error here, and may occur before a test sample is actually analysed. Incorrect sample collection or labelling and transportation errors may occur, and are probably more prevalent than analytical errors in the laboratory. Nevertheless, there may be faults in a particular assay or with the assay sensitivity. Equipment errors can also occur, for example with ECG machines and CT scanners.
The general rule with laboratory test results is to consider if the results fit the clinical context. If they do not, consider repeating the tests with the same or a different laboratory.
An example of a laboratory error is given in the Box.
Reporting error
Reporting errors are almost always due to human error and are very common. Many tests require a visual interpretation by the reporting specialist, and errors easily occur due to factors such as fatigue or inattention, inexperience on the part of the reporting doctor, inadequate training of the reporting doctor and personal bias. Image-based tests such as ECG, echocardiography, endoscopy and most radiology tests are particularly susceptible here.
This raises the question as to who is most qualified to report on a particular test. For instance, many ECGs are reported by doctors who are not cardiologists, let alone cardiac electrophysiologists, and Holter monitor traces and echocardiograms (echos) are regularly reported by doctors who have not received specific training in the relevant area. Some years ago, an electrophysiology colleague and the author blindly reviewed 100 unselected ECG reports sourced from several pathology firms and found that 28% of the ECG reports were incorrect, ranging from minor errors such as incorrect axis deviation through to major errors such as completely incorrect rhythm (unpublished data).
A common error is a report that fails to address the clinical problem in the first place. For instance, the greatest value of a Holter monitor test is to associate a particular symptom with the finding (or absence) of a rhythm disturbance at that time, yet many Holter monitor reports fail to address this key question accurately, if at all. Minimalist reports are common and essentially useless; for instance ‘frequent PVCs’ is a common report yet is often not defined numerically, and with no information given regarding the pattern or behaviour of the premature ventricular contractions, which would be desirable.
Tests involving imaging are inherently prone to reporting error because there is necessarily a subjective component to the interpretation of an image. For example, some years ago a single chest x-ray was shown blind to experienced radiologists who were asked to report whether any signs of congestion (e.g. upper lobe venous distension) were present: half the radiologists reported the x-ray as normal and half reported the presence of congestion (personal communication, Dr Ken Thompson).
In echocardiography, the normal phenomenon of a Doppler signal being generated by transiently reversed blood movement as valves close is frequently reported as ‘mild’ valvular regurgitation, possibly falsely suggesting valvular pathology. In the author’s experience, valvular regurgitation is commonly overestimated on many echo reports. Many patients have been referred for specialist review because of ‘moderate’ mitral regurgitation on an echo report, but they have no symptoms, no cardiac dilatation (which is expected with chronic mitral leaks of moderate severity) and a trivial murmur that suggests mild regurgitation at most.
The effect of reporting errors can be reduced by always considering a report in the clinical context, and ensuring the report findings are consistent with the patient’s symptoms and clinical signs.
Quality of test equipment and method
Technology improves at a rapid rate, and this flows through to the quality of equipment used in diagnostic testing. The equipment available now for CT, MRI and echocardiography is superior to that available just a few years ago. Hence not all laboratories and facilities offer the latest or most accurate technology. For example, lower resolution coronary CT scanners are more likely to misjudge the true state of coronary anatomy.
It requires only a little inquiry and investigation to determine which facility offers the highest likelihood of accurate results, in terms of both equipment used and operator experience and reliability, as alluded to in the previous section. Doctors should be prepared to shop around and not restrict referrals to just one facility or laboratory, however convenient.
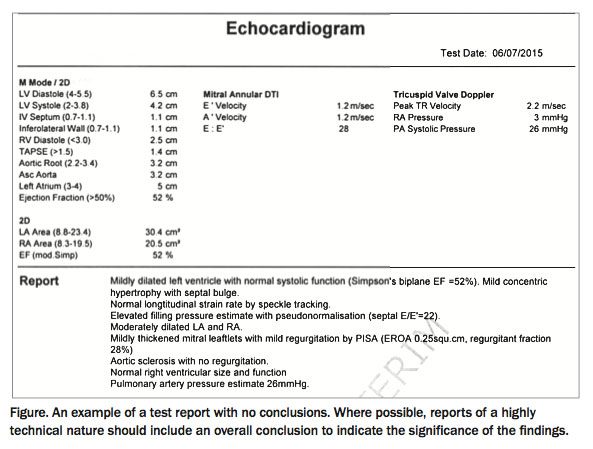
Reports not easily understood
Problems with the understanding and interpreting of reports are most likely to occur when reports contain highly technical terminology. For example, the inclusion of a summary or conclusion would indicate the significance of a 28% regurgitation fraction in the echo report example in the Figure. Similar difficulties may be encountered with, for example, pacemaker or implantable cardioverter defibrillator clinic reports and complex histological findings.
Reproducibility error
All the tests doctors request on patients measure biological variables, and as such are inherently prone to reproducibility error (better expressed as repeatability error). This is rarely inconsequential and often quite substantial, but may not appear in a test report and is often omitted even in published clinical trials.
Repeatability error can be inter- or intra-observer and reflects both human and equipment factors. For example, cholesterol levels of 5.8 mmol/L and 6.5 mmol/L fall within repeatability error for that measurement and therefore may not indicate any significant change on serial lipid levels, yet a rise in cholesterol is the usual interpretation of such results and may be acted upon inappropriately. Similarly, a potassium level of 5.2 mmol/L when the upper limit of normal is 5.0 mmol/L does not necessarily signify true hyperkalaemia.
Reference intervals quoted in test results are specific values, yet repeatability error ensures that true normal or abnormal results may lie either side of the line. The author and colleagues have previously published repeatability error for best-quality M-mode echocardiographic measurement of left ventricular wall thickness and found it to be ±2 mm.1 The cut-off for left ventricular hypertrophy (LVH) is a specific value of 1.1 cm, which implies that 1.0 cm is normal and 1.2 cm is LVH, yet both fall within the repeatability error of this measurement. Similarly, left ventricular ejection fraction (LVEF) measurement by the several available imaging modalities has an error rate of at least ±5%, although this is not always quoted. Therefore, an LVEF of 45% may be actually no different to an LVEF of 37% on another occasion, yet would be interpreted by many as a definite significant decline in LV function. The repeatability error can be quite large in some tests, such as the estimating of pulmonary arterial pressure on echocardiography.
Biological variables are also subject to loading conditions. For example, a patient with aortic stenosis who is mildly dehydrated on the day of echocardiography may return a higher transvalvular gradient than an echo performed a day later with the patient fluid replete.
Test reports rarely quote an estimate of repeatability error (perhaps to avoid confusion), but this should be taken into account when the test report is considered, especially when results on the fringes of the reference interval occur.
Predictive accuracy of test results
The predictive accuracy of a test is expressed in terms of Bayes’ theorem, which when applied to tests basically states that the post-test probability of disease in a test result is greatly influenced by the pre-test probability of disease (Bayes’ theorem describes the probability of an event based on prior knowledge of conditions that might be related to the event, i.e. conditional probability).
As an extreme example, an abnormal stress test result in an 18-year-old woman with chest pain and few risk factors is almost certainly a false positive, as coronary disease is very rare in this demographic. Similarly, a negative stress test in a 65-year-old man with exertional chest pain who is a smoker and has hypertension and diabetes is very likely to be wrong. Indeed in both cases the stress test was inappropriate in the first place, as the pretest probability of disease was so low/high respectively. Diagnostic tests are most useful when there is an intermediate pretest likelihood of disease.
Most diagnostic tests have predictive accuracy of either positive or negative results, which is linked to the concept of test sensitivity and specificity. It is important to appreciate these factors when ordering and interpreting a particular test. For example, a passive tilt table test (TTT) has a very high specificity for vasovagal syncope but a low sensitivity – that is, a positive test is likely diagnostic but a negative test does not at all exclude the diagnosis.2 On the other hand, for a TTT with isoprenaline provocation the reverse applies – a negative result makes vasovagal syndrome much less likely but false positives are very common.
Troponin level is a fashionable measurement nowadays, although it is often used inappropriately or to minimise medicolegal risk. Mildly elevated results not due to myocardial infarction are common, being due to, for example, tachyarrhythmia, syncope, heart failure or renal failure. If this is not appreciated, it may result in unnecessary hospitalisation and expensive and invasive further investigation. Troponin measurement was introduced as a quick method to exclude myocardial injury and to assess potential risk, not as an excuse for often unnecessary cardiac catheterisation.
The ‘normal’ range
Many tests quote defined limits as a reference interval. This is typically set at plus or minus two standard deviations from the mean in apparently healthy subjects, which covers 95% of the healthy population tested; the results of 5% of apparently healthy subjects will therefore lie outside this range. For some investigations, however, ‘normality’ is less well defined. Furthermore, results outside the reference interval in one clinical setting may be quite acceptable (indeed ‘normal’) in another. It is important to appreciate these apparent variations to avoid unnecessary treatment.
For example, a Holter monitor test in an adolescent that reports frequent (more than 0.5%) atrial or ventricular ectopy is likely abnormal, yet such findings are commonplace in the elderly, especially if there is coexistent morbidity such as hypertension. The Framingham data from the 1970s, with Holter monitoring performed in 5000 residents of Framingham in Massachusetts, reported 40% ventricular ectopy, 12% complex forms and even 2% nonsustained ventricular tachycardia (NSVT) runs – this was in a free-living population, not just patients.3 Many of the elderly patients in the author’s pacemaker clinic routinely have runs of NSVT recorded on the device that are completely asymptomatic and usually do not require intervention.
A related scenario is that of thyroid function test (TFT) results in patients who take amiodarone. These are often misinterpreted as thyroid disease when it may be a simple drug effect. Amiodarone can have variable effects on TFTs, often slight thyroid stimulating hormone (TSH) suppression and/or mildly raised thyroxine (T4) with normal triiodothyronine (T3). This is not thyrotoxicosis, although it should be monitored carefully. Another common example is raised T4 and raised TSH in the one patient. The endocrinology mantra to always normalise the TSH level does not always apply in this case; thyroxine therapy actually may be problematic in this situation.
Tests with large repeatability error are also easily misinterpreted if the report does not allow for this. A good example is pulmonary arterial pressure estimate by echocardiography: an apparently elevated result will often be reported as ‘pulmonary hypertension’ but may in fact be normal.
Inappropriate test selection
Before ordering any diagnostic investigation, whether simple blood sugar level, colonoscopy or renal biopsy, it is essential to have a clear diagnostic question in mind. It follows therefore that the diagnostic test chosen is appropriate, as an unsuitable test will not contribute to resolving the diagnostic dilemma. For example, carotid Doppler ultrasound is often performed in patients presenting with syncope, yet the clinical return from this test is extremely low as carotid disease does not cause syncope. Another example is measurement of TSH level alone in patients taking amiodarone; full TFTs are required for the reasons discussed above.
Predictive accuracy is also relevant here, as discussed in the stress test examples cited above. Similarly, when patient with a pacemaker presents with occasional syncope or rapid palpitation, interrogation of the device will have a much greater yield than 24-hour Holter monitoring.
It is also worth mentioning at this point that the more details provided in the test request slip, the more it will assist the reporting process, particularly with imaging and operator-dependent investigations. Supplying specific clinical information (and stating the diagnostic question to be evaluated by the test) greatly improves the likelihood of obtaining useful information from the test result.
Minimising misinterpretation
To minimise misinterpretation of test results, risks to patients and expense to the health system and to maximise clinical return when ordering any diagnostic investigation, the following points should be considered:
- never assume a test result is absolutely accurate, as misleading or frankly incorrect results are common.Wherever possible, look at the actual images provided (e.g. an ECG). For any result, ask yourself: – does it make sense? – does it fit the clinical context?
- if there is any doubt about a test result then consider repeating the test and/or seek expert advice
- be aware of the inherent limitations of the chosen investigation, and select the optimal service provider for that test
- ensure the investigation you select is capable of answering the clinical question, and therefore be clear as to the diagnostic question you are asking
- always treat the patient and not just the test result; a careful history and physical examination in the first instance is mandatory yet often overlooked.
Conclusion
Diagnostic test results should always be interpreted with consideration of the clinical context. Test results should not be assumed to be absolutely accurate as misleading or incorrect results are common. Misinterpretation can be minimised by the use of appropriate tests and being aware of the limitations of tests and the types of errors that occur. Above all, it is always good practice to treat the patient, not the test result.
References
- Murray Y, Kinghorn A, Tonkin A, Kertes P. Comparison of screen derived and hardcopy M-mode measurements of left ventricular dimensions. 38th Annual Scientific Meeting, Cardiac Society of Australia and New Zealand; Hobart, May 1990. [Abstract] Aust N Z J Med 1990; 20(Suppl s1): 323.
- Moya A, Sutton R, Ammirati F, et al. Guidelines for the diagnosis and management of syncope (Version 2009). Eur Heart J 2009; 30: 2631-2671.
- Bikkina M, Larson MG, Levy D. Prognostic implications of asymptomatic ventricular arrhythmias: the Framingham Heart Study. Ann Intern Med 1992; 117: 990-996.